Introduction
In technical analysis, one of the most important concepts traders must understand is how support levels can turn into resistance levels.
This phenomenon occurs frequently in trending markets and provides valuable opportunities for traders to identify potential entry points.
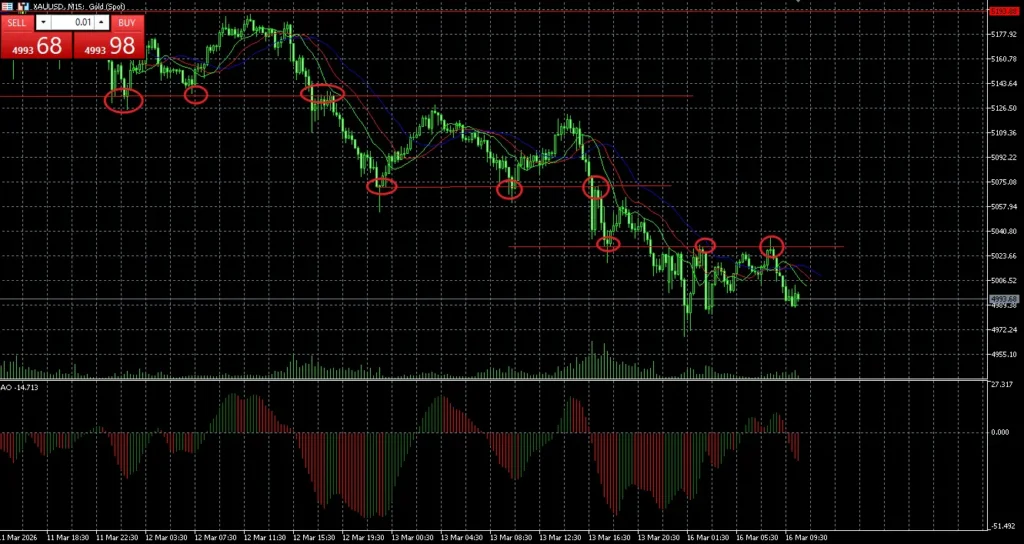
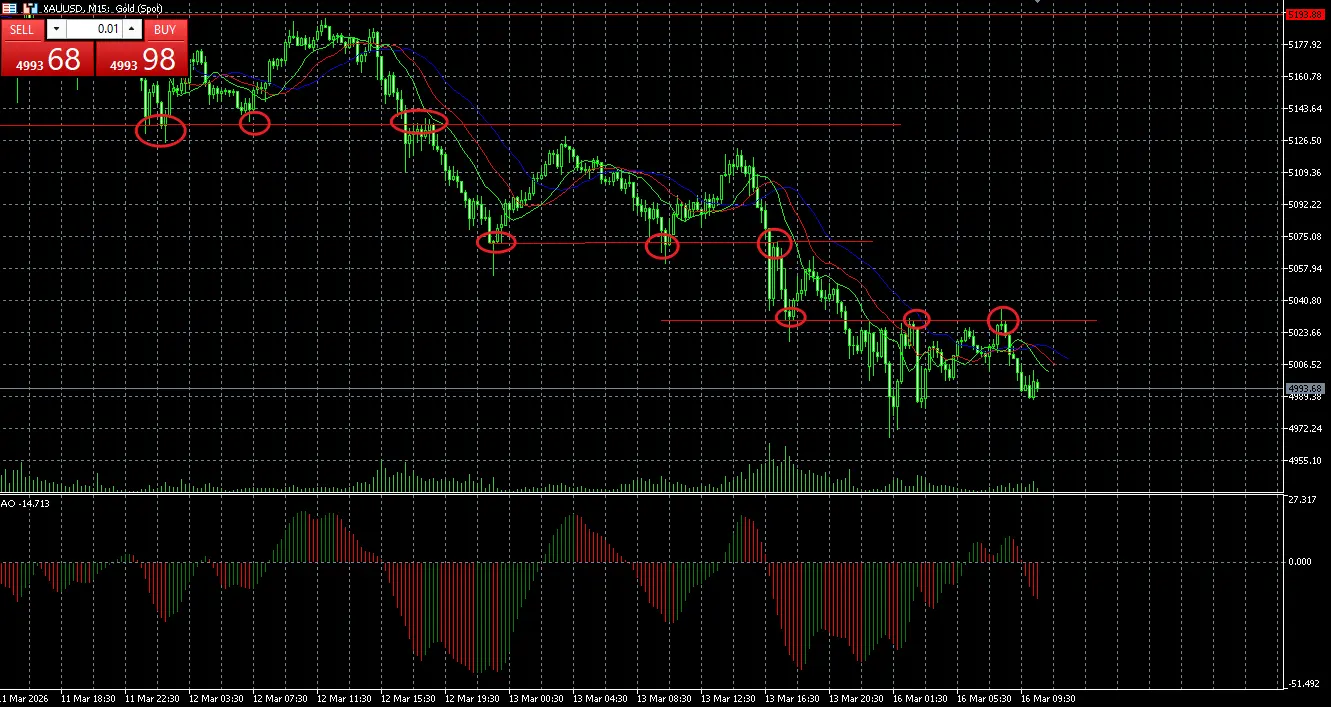
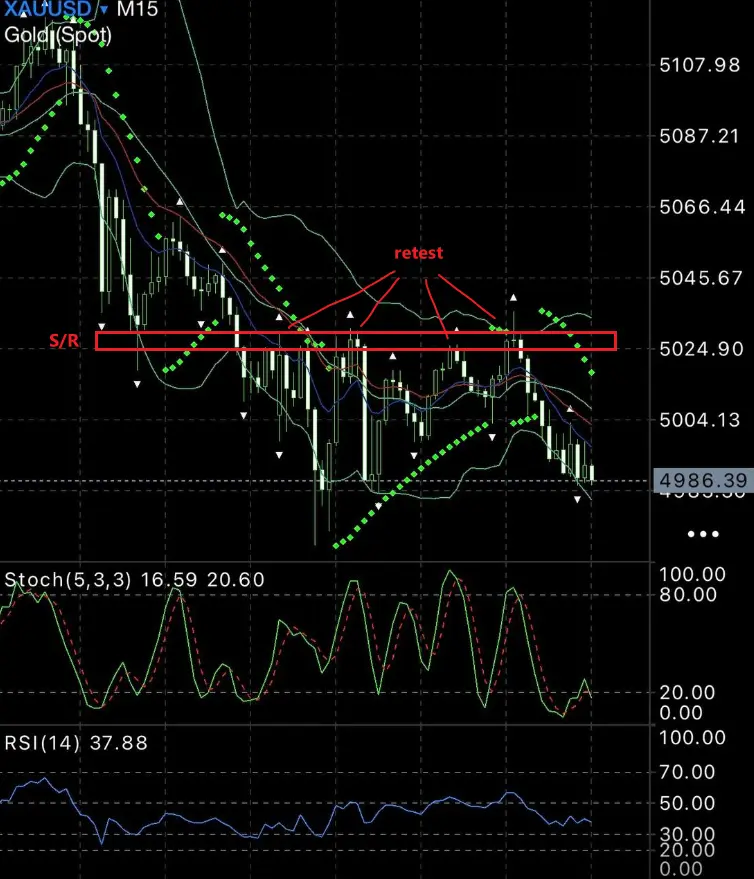
In this example using the Gold (XAUUSD) 15-minute chart, we can clearly see how previous support zones later acted as resistance, confirming the continuation of the bearish trend.
Understanding this concept can significantly improve a trader’s ability to read market structure.
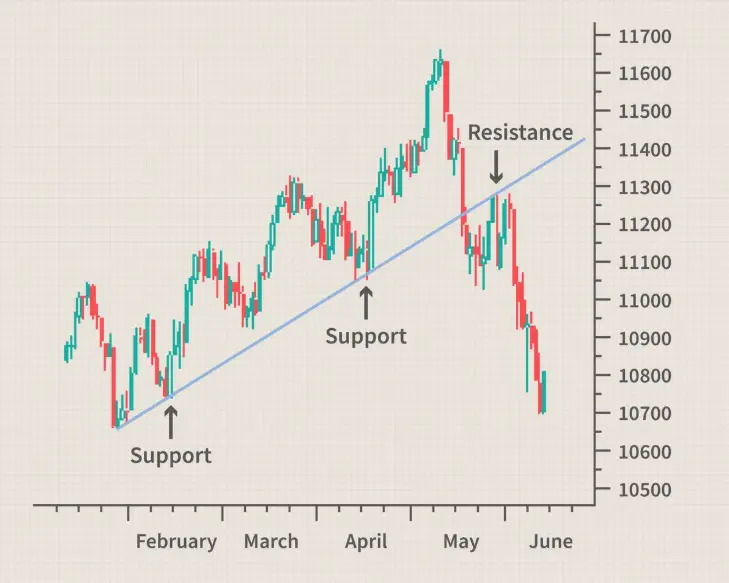
What is Support and Resistance?
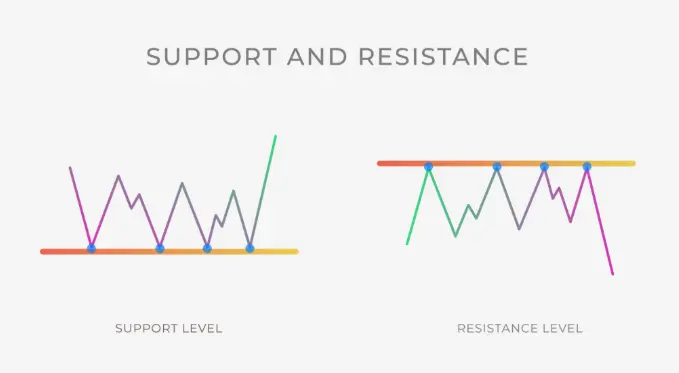
Support and resistance are fundamental concepts in technical analysis.
Support
A support level is a price zone where buying pressure tends to appear, preventing the price from falling further.
Resistance
A resistance level is a price area where selling pressure tends to emerge, preventing the price from rising higher.
These levels often form due to market psychology, order flow, and previous price reactions.
The Support Turns Resistance Concept
A common phenomenon in trading is when a broken support level becomes a new resistance level.
This happens because:
- Traders who previously bought at the support level may start selling when price returns.
- Short sellers use the broken level as an opportunity to enter new positions.
- Market sentiment shifts from bullish to bearish.
As a result, the previous support area begins to act as resistance.
Gold (XAUUSD) Chart Example
In the chart above, several key price levels were highlighted.
We can observe the following sequence:
1. Price initially bounced multiple times from support, confirming a strong demand area.
2. Eventually, the support level was broken, signaling bearish momentum.
3. When price later retraced upward, the same level acted as resistance, rejecting price and pushing the market lower again.
This pattern repeated multiple times, confirming a clear downtrend structure.
Why This Pattern is Important for Traders
The support-to-resistance flip is extremely useful for traders because it helps identify high-probability setups.
When a strong support level breaks:
- The market structure shifts
- The previous demand zone becomes a supply zone
- Traders often look for sell opportunities on retests
This concept is commonly used in:
- Forex trading
- Commodity markets
- Cryptocurrency trading
- Stock trading
Simple Trading Strategy Using Support Turning Resistance
A basic strategy using this concept involves three steps.
Step 1 – Identify Strong Support
Look for price levels where the market has bounced multiple times.
Step 2 – Wait for the Break
Once price breaks the support level with momentum, the market structure changes.
Step 3 – Wait for the Retest
When price returns to the broken support level, traders may look for bearish confirmation signals such as:
- Rejection candles
- Lower highs
- Bearish engulfing patterns
This area becomes a potential sell zone.
Why Support Becomes Resistance in Forex Trading?
In forex trading, the phenomenon where support levels turn into resistance levels is a common occurrence after a strong price breakout.
This happens because market sentiment changes once a key support level is broken. Traders who previously bought at the support level may start closing their positions when price returns to that area, while new sellers often enter the market expecting further downside movement.
As a result, the previous support zone becomes a new resistance area.
This concept is strongly related to market psychology and order flow. When the market breaks below an important support level, it signals that sellers have taken control. When price retraces back to the broken level, selling pressure often appears again.
In forex markets, traders frequently use this pattern to identify high-probability sell opportunities. A common approach is to wait for price to retest the broken support level and look for bearish confirmation signals such as rejection candles, lower highs, or bearish engulfing patterns.
Understanding why support becomes resistance can help traders better read market structure and improve their decision-making when trading currency pairs.
Risk Management(Important)
Even strong technical patterns can fail, so risk management is essential.
Traders should consider:
- Placing stop losses above the resistance level
- Risking only a small percentage per trade
- Avoiding overtrading during volatile market conditions
Conclusion
The support becomes resistance concept is one of the most powerful principles in technical analysis.
As shown in the Gold M15 chart example, once a support level breaks, it often becomes a resistance level during retracements. This shift in market structure can provide valuable trading opportunities for traders who understand how to read price action.
By combining this concept with proper risk management and confirmation signals, traders can significantly improve their trading decisions.
About the Author
David William – Professional Forex & Crypto Trader
David William is a trader specializing in forex, gold (XAUUSD), and cryptocurrency markets. With over 8 years of trading experience, he focuses on technical analysis, price action, and market structure to identify high-probability trading opportunities.
More trading insights at trading-strategy-hub.com
Disclaimer: This analysis is for educational purposes only and does not constitute financial advice.