Introduction
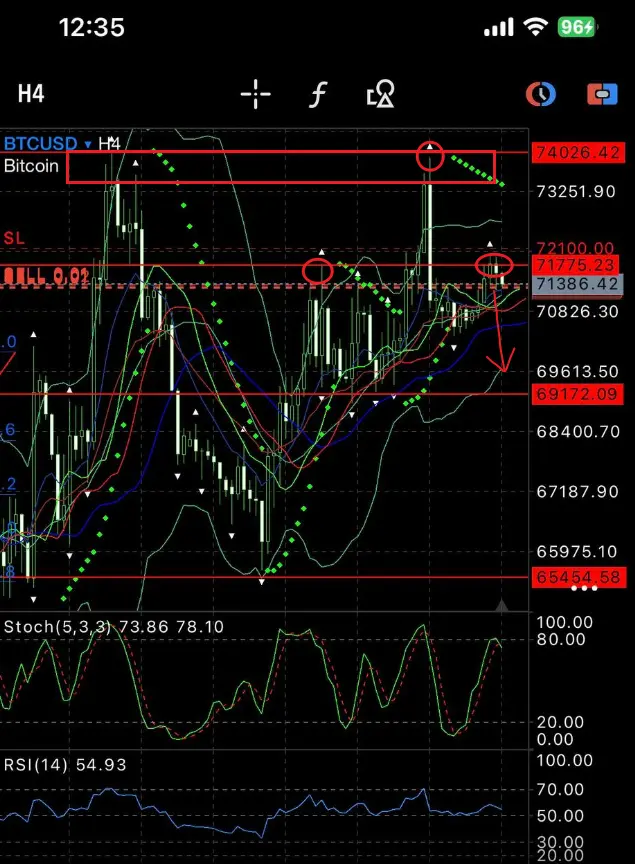
Bitcoin (BTCUSD) is currently approaching a critical technical zone on the H4 chart, where price action appears to be forming a head and shoulders pattern, a classic reversal structure widely observed in technical analysis.
This pattern often indicates that bullish momentum may be weakening, and traders are closely watching whether Bitcoin will break below key support levels.
In this analysis, we examine the current BTCUSD price structure and potential trading scenarios based on market behavior and technical indicators.
BTCUSD H4 Chart Overview
On the H4 timeframe, Bitcoin recently pushed higher after a strong bullish move. However, price action is now showing signs of exhaustion near a key resistance zone around the 73,000–74,000 region.
The chart structure suggests the possible formation of a head and shoulders pattern, which typically consists of:
- A left shoulder
- A higher peak forming the head
- A right shoulder forming near resistance
If confirmed, this pattern could signal a potential short-term bearish reversal.
On the H4 timeframe, Bitcoin recently pushed higher after a strong bullish move. However, price action is now showing signs of exhaustion near a key resistance zone around the 73,000–74,000 region.
The chart structure suggests the possible formation of a head and shoulders pattern, which typically consists of:
- A left shoulder
- A higher peak forming the head
- A right shoulder forming near resistance
Key Resistance and Support Levels
Several important price levels can be identified on the chart:
Resistance Zone
The primary resistance area is located near:
Key resistance: 74,000
Immediate resistance: 72,100
This level has already rejected price multiple times, suggesting strong selling pressure from the market.
Support Levels
Key support areas to monitor include:
Key support: 71,700
Next support: 69,100
Major support: 65,450
A break below these levels could accelerate bearish momentum.
Technical Indicators
Several indicators on the chart also provide useful signals.
RSI (Relative Strength Index)
The RSI indicator is currently hovering around the neutral zone, suggesting that the market is losing upward momentum after the recent rally.
If RSI begins to move downward while price fails to break resistance, this could support the bearish scenario.
Stochastic Oscillator
The stochastic indicator is approaching the overbought region, which sometimes precedes short-term corrections.
Traders often watch for a bearish crossover as confirmation of weakening momentum.
Potential Trading Scenario
If the head and shoulders pattern completes, traders may watch for a break below the neckline area around 71,700.
A confirmed breakdown could open the path toward:
69,100
and potentially
65,400
However, if Bitcoin manages to break and hold above the 74,000 resistance, the bearish pattern could be invalidated and the market may continue its bullish trend.
Market Outlook
The BTCUSD H4 chart currently presents a potential head and shoulders formation, which could signal a short-term reversal if key support levels are broken.
Traders should monitor the 71,700 support and 74,000 resistance levels closely, as a breakout from this range could determine the next directional move.
About the Author
David William – Professional Forex & Crypto Trader
David William is a trader specializing in forex, gold (XAUUSD), and cryptocurrency markets. With over 8 years of trading experience, he focuses on technical analysis, price action, and market structure to identify high-probability trading opportunities.
More trading insights at trading-strategy-hub.com
Disclaimer: This analysis is for educational purposes only and does not constitute financial advice.