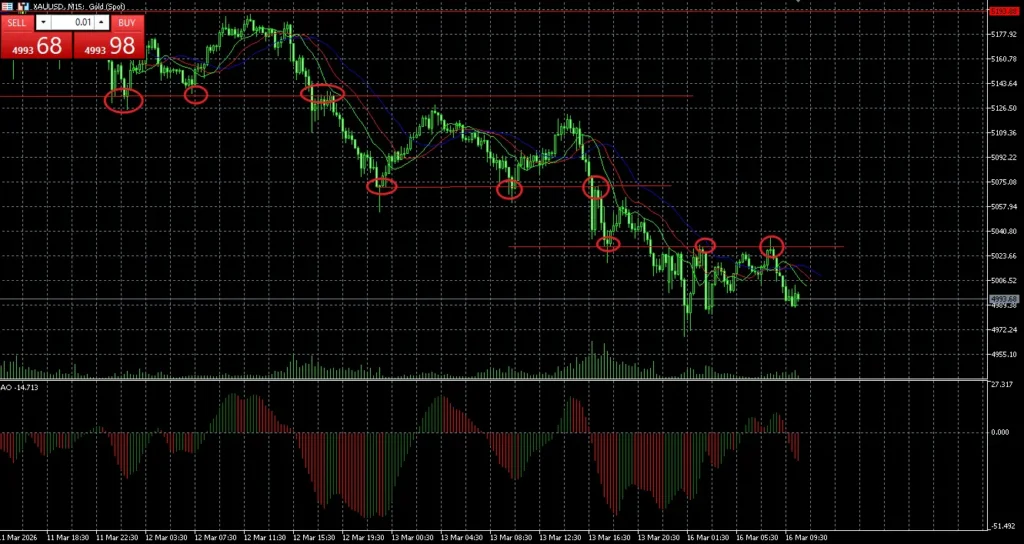
How Support Becomes Resistance in Trading (Gold M15 Chart Example)
Introduction In technical analysis, one of the most important concepts traders must understand is how support levels can turn into […]
Introduction In technical analysis, one of the most important concepts traders must understand is how support levels can turn into […]
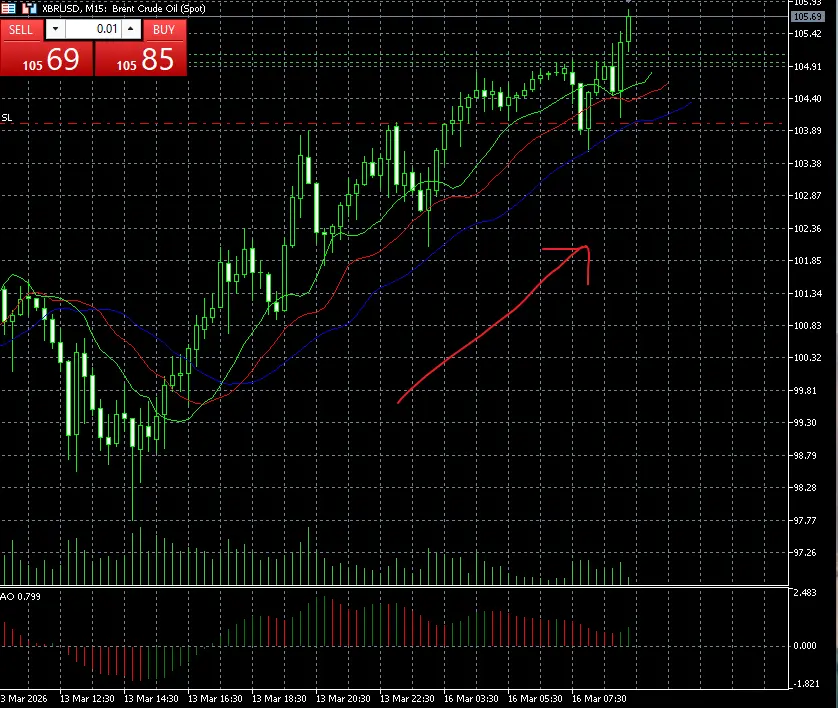
Market Overview In the latest Brent Crude Oil (UKOIL) market session, the price action on the 15-minute timeframe (M15) shows
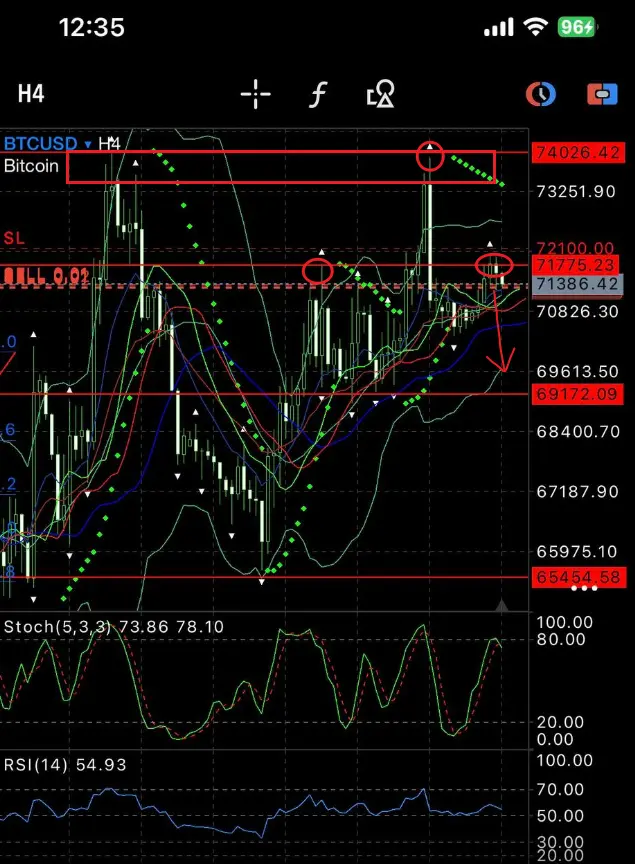
Introduction Bitcoin (BTCUSD) is currently approaching a critical technical zone on the H4 chart, where price action appears to be
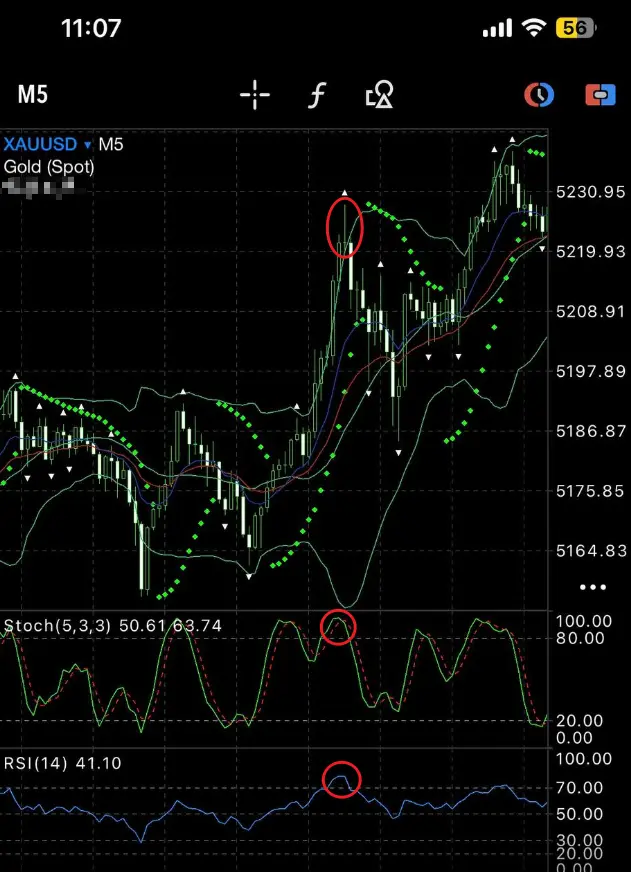
Once you understand key indicators RSI, it becomes one of the most powerful tools in trading. In this guide, we
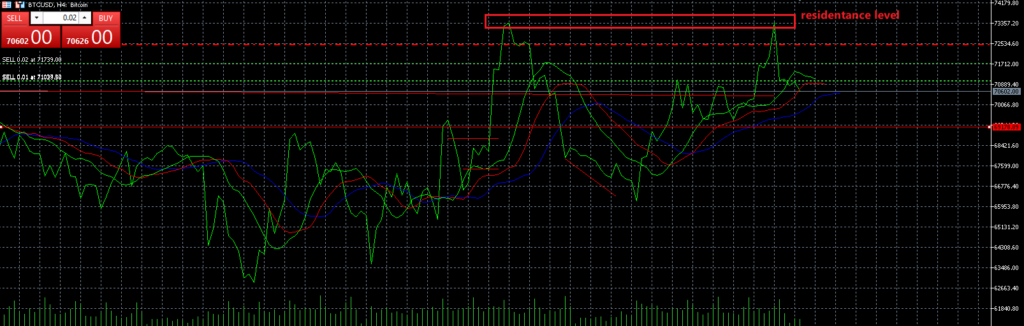
Bitcoin outlook, Bitcoin outlook, Trading Strategies Chart timeframe: H4This BTCUSD analysis shows that the price was rejected from a key

In the ever-changing landscape of the financial markets, mastering the art of risk management is paramount to safeguarding your investments
In today’s dynamic financial landscape, market volatility presents both challenges and opportunities for traders. “Mastering Market Volatility: Strategies for Thriving

Demystifying Technical Analysis: A Beginner’s Guide to Chart Patterns and Indicators” offers an accessible entry point into the world of