Bitcoin outlook, Bitcoin outlook, Trading Strategies
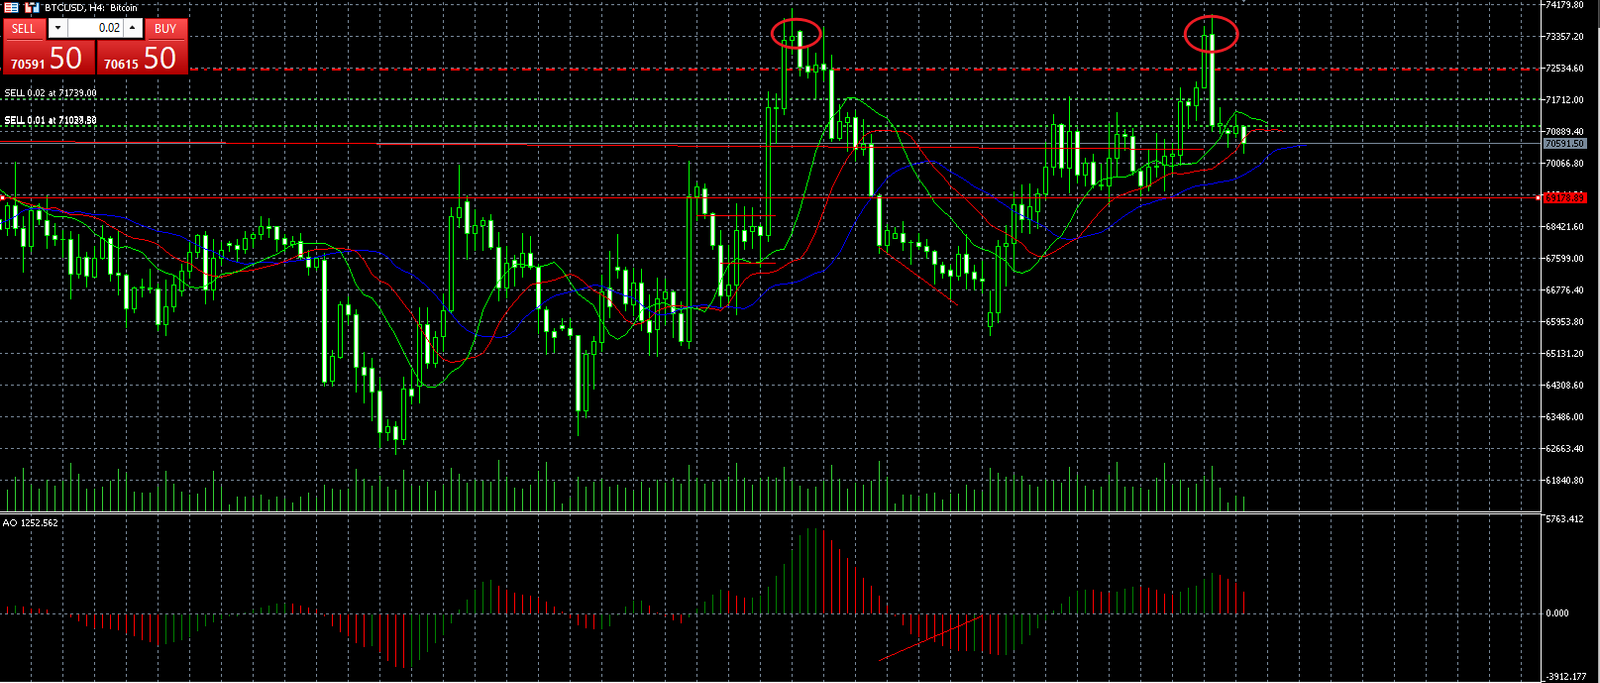
Chart timeframe: H4
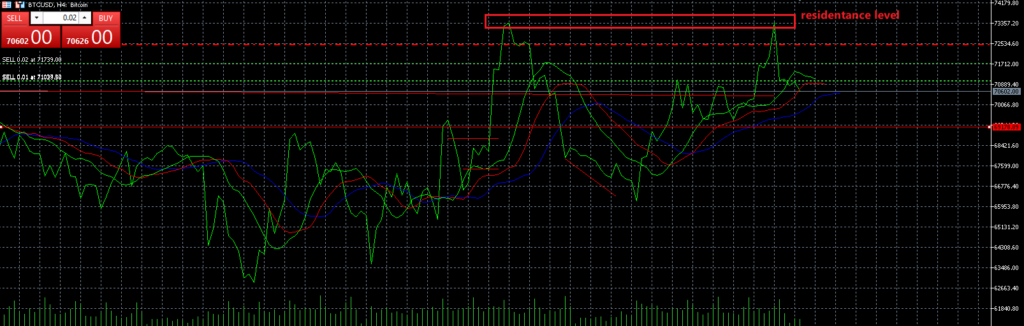
This BTCUSD analysis shows that the price was rejected from a key resistance level.
BTCUSD recently tested a key resistance level and showed a clear rejection from that zone.The price failed to sustain above the resistance, indicating that selling pressure is still strong.
Key Resistance Level
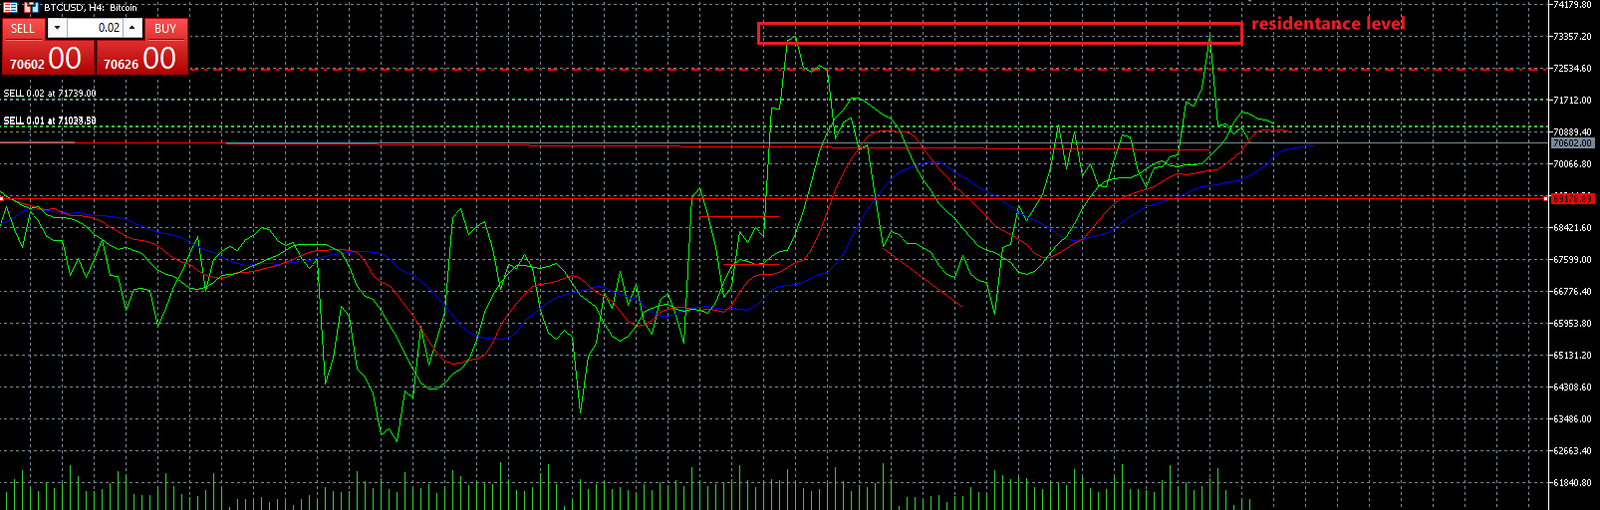
Chart timeframe: H4
From the H4 chart, BTCUSD approached a strong resistance area where the price had previously reacted.
As shown in the chart, the market attempted to break above this level multiple times but failed to maintain momentum.
The long upper wicks indicate strong rejection from sellers in that zone.
This suggests that the resistance level is still being respected by the market.
Lower Timeframe Confirmation
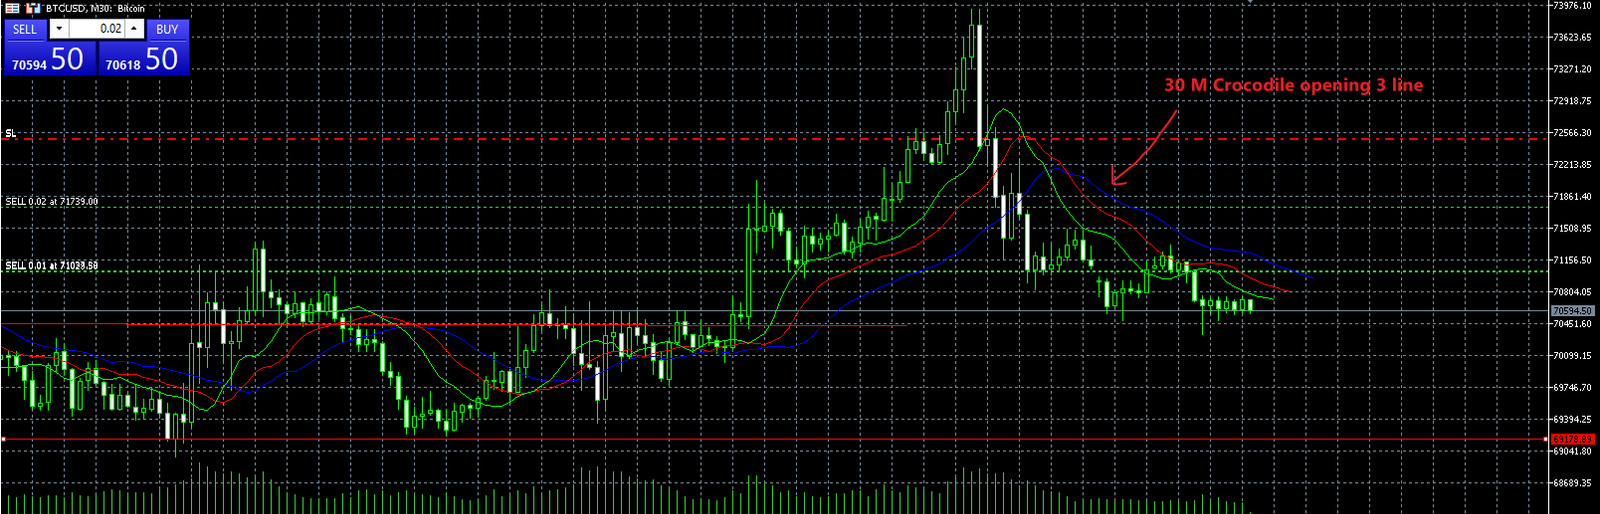
Confirmation timeframe: M30
Looking at the lower timeframe, the M30 chart provides additional confirmation.
The Alligator indicator shows the three lines (Jaw, Teeth, and Lips) beginning to open downward.
This behavior typically signals that bearish momentum is building and the market may be entering a short-term downtrend.
When the Alligator lines spread apart while pointing downward, it often indicates that the market is transitioning from consolidation into a trending phase.
About the Author
David William – Professional Forex & Crypto Trader
David William is a trader specializing in forex, gold (XAUUSD), and cryptocurrency markets. With over 8 years of trading experience, he focuses on technical analysis, price action, and market structure to identify high-probability trading opportunities.
More trading insights at trading-strategy-hub.com
Disclaimer: This analysis is for educational purposes only and does not constitute financial advice.