The bearish engulfing candlestick pattern is one of the most powerful reversal signals in technical analysis. It helps traders identify potential market tops and signals when a bullish trend may be coming to an end.
In this guide, you’ll learn what the bearish engulfing pattern is, how to identify it, and how to trade it effectively across forex, stocks, and crypto markets.
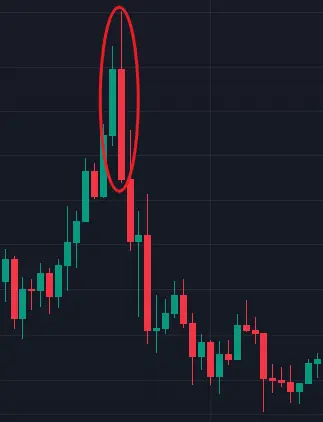
What Is a Bearish Engulfing Pattern?
A bearish engulfing pattern is a two-candle reversal formation that appears at the end of an uptrend. It signals that sellers (bears) are taking control from buyers (bulls).
Structure of the Pattern:
- First candle: A small bullish (green) candle
- Second candle: A larger bearish (red) candle that fully engulfs the body of the previous candle
This pattern shows a strong shift in momentum from bullish to bearish.
Why Is the Bearish Engulfing Pattern Important?
The bearish engulfing pattern is important because it indicates:
- A potential trend reversal
- Strong selling pressure
- A shift in market sentiment
Traders use this pattern to:
- Enter short (sell) positions
- Exit long (buy) trades
- Confirm resistance levels
How to Identify a Bearish Engulfing Pattern
To correctly identify this pattern, look for the following conditions:
- Existing uptrend
The pattern must appear after a clear bullish trend. - Small bullish candle
The first candle reflects continued buying pressure. - Large bearish candle
The second candle opens higher and closes lower than the previous candle’s body. - Full engulfing
The body of the second candle completely covers the first candle’s body.
How to Trade the Bearish Engulfing Pattern
1. Entry Point
Enter a sell trade after the bearish engulfing candle closes. Conservative traders may wait for additional confirmation, such as a break below support.
2. Stop Loss
Place your stop loss:
- Above the high of the engulfing candle
- Or above a recent resistance level
3. Take Profit
Set your take profit using:
- Previous support levels
- Risk-to-reward ratio (e.g., 1:2 or 1:3)
- Fibonacci retracement levels
Best Indicators to Use with Bearish Engulfing
To improve accuracy, combine this pattern with:
- Relative Strength Index (RSI)
Look for overbought conditions (above 70) - Moving Averages
Confirm trend direction and resistance zones - Volume
Increased volume strengthens the signal - Support and Resistance
Patterns near resistance are more reliable
Common Mistakes to Avoid
1. Ignoring the Trend
This pattern is most effective after an uptrend, not in sideways markets.
2. No Confirmation
Avoid trading based on the pattern alone—combine it with other signals.
3. Poor Risk Management
Always define your stop loss and position size before entering a trade.
Real-World Example
Imagine a market that has been rising steadily:
- Day 1: A small green candle forms
- Day 2: A large red candle fully engulfs it
This suggests sellers have taken control, and the price may start moving downward.
Advantages and Disadvantages
Advantages
- Easy to identify
- Strong reversal signal when confirmed
- Works across all markets
Disadvantages
- Can produce false signals
- Requires confirmation
- Less effective in choppy markets
Conclusion
The bearish engulfing candlestick pattern is a powerful signal that can help traders spot potential market reversals. When used with proper confirmation and risk management, it can become a valuable part of your trading strategy.
Always combine it with other technical tools and avoid relying on a single indicator for decision-making.
Final Tips
- Trade with the trend context
- Use confirmation indicators
- Manage risk carefully
- Backtest your strategy
Mastering the bearish engulfing pattern can help you identify high-probability short opportunities and improve your overall trading performance.
Related Candlestick Patterns
Looking for the opposite of the bearish engulfing pattern?
Bullish Engulfing Candlestick Pattern – A strong reversal signal that appears after a downtrend and indicates buyers are taking control.
Read the full guide here:
Bullish Engulfing Candlestick Pattern Guide
You may also like:
Shooting Star Pattern – Bearish reversal at resistance
Doji Candlestick Patterns – Market indecision signals
Hammer Candlestick Pattern – Bullish reversal at support
About the Author
David William – Professional Forex & Crypto Trader
More trading insights at trading-strategy-hub.com
Disclaimer: This content is for educational purposes only and does not constitute financial advice.