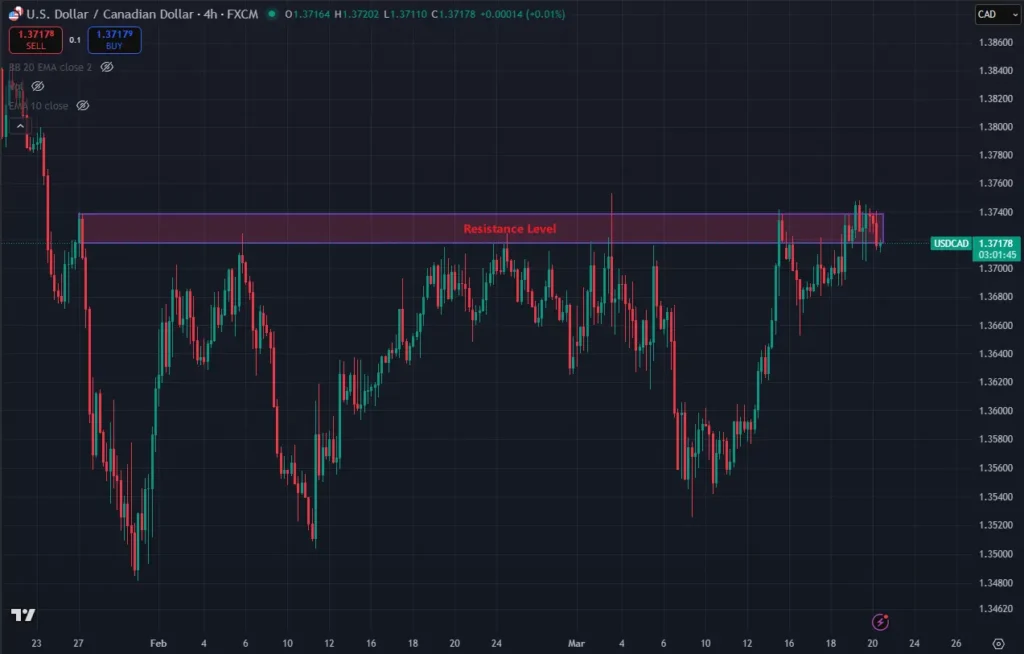
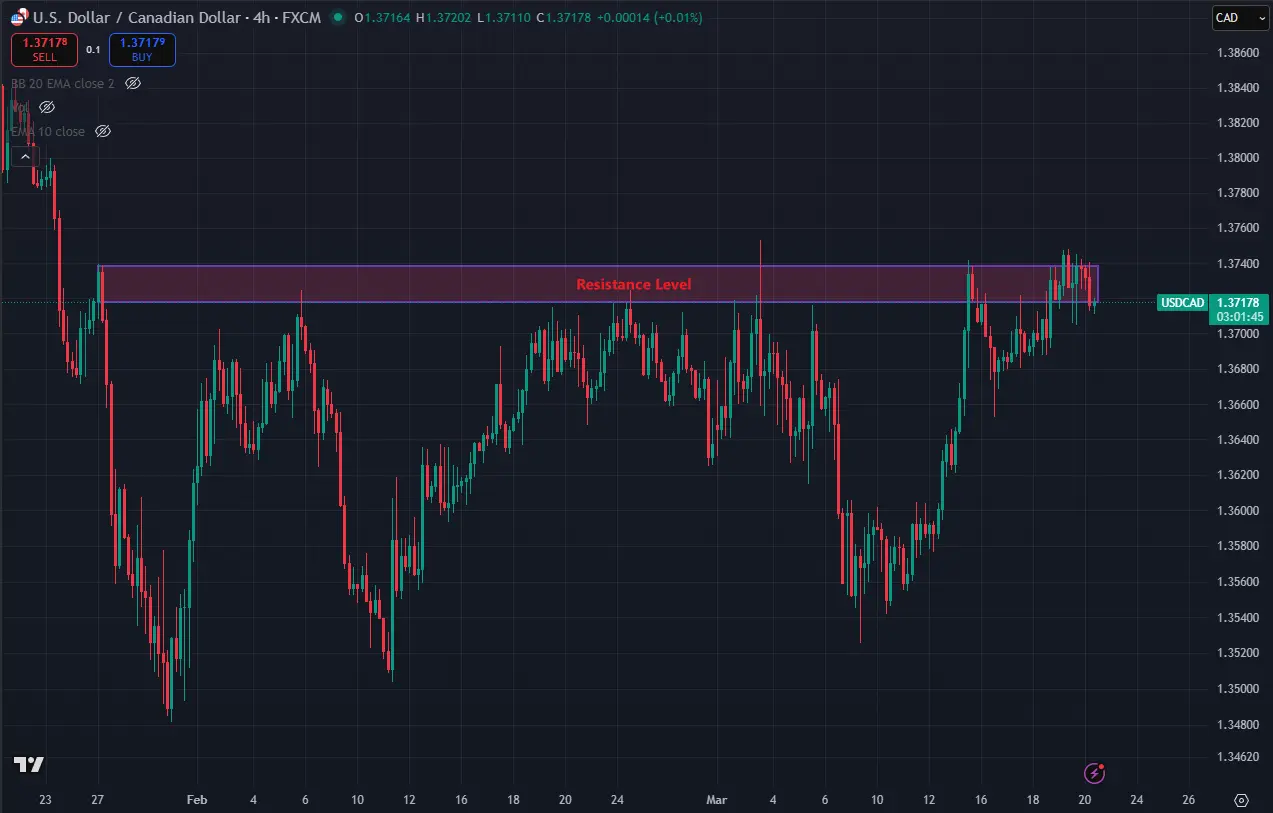
The USD/CAD pair on the 4-hour timeframe is testing a well-defined resistance zone, where price has previously shown multiple rejections. This area has consistently acted as a barrier, making it a potential zone for a short-term selling opportunity.
Market Structure & Key Observations
- Price has approached the resistance level several times, as shown on the chart
- Each test of the zone has resulted in rejection or pullback
- The current price action shows slowing momentum near resistance
- This suggests possible seller interest returning to the market
This type of structure often leads to either a rejection or a false breakout before moving lower.
Trade Setup – Light Short Position
Given the strength of the resistance zone, a light position short (sell) is considered at current levels.
Entry Idea:
Sell near resistance (~1.3720 – 1.3740)
Take Profit Targets:
- TP1: 1.3680
- TP2: 1.3620
- TP3: 1.3550
Stop Loss:
- SL: 1.37600
Risk Management
- This is a counter-momentum setup, so position size should be kept small
- Wait for confirmation signals (bearish candle / rejection wick) before entering
- If price breaks and holds above resistance, bullish continuation is likely
- Always respect the stop loss level
Trading Insight
Resistance zones with multiple touches often attract liquidity. However, repeated testing can weaken the level over time.
That’s why this setup focuses on:
- Light position sizing
- Clear invalidation (SL above resistance)
- Structured take-profit levels
Conclusion
USD/CAD is currently trading at a key resistance zone on the H4 chart. A rejection from this level could provide a short-term selling opportunity, but traders should remain cautious of a potential breakout.
This setup favors a light short position, with strict risk control and confirmation-based entry.
About the Author
David William – Professional Forex & Crypto Trader
More trading insights at trading-strategy-hub.com
Disclaimer: This analysis is for educational purposes only and does not constitute financial advice.