Market Overview
Why ETHUSD Shows Bearish Signals in Intraday Trading?
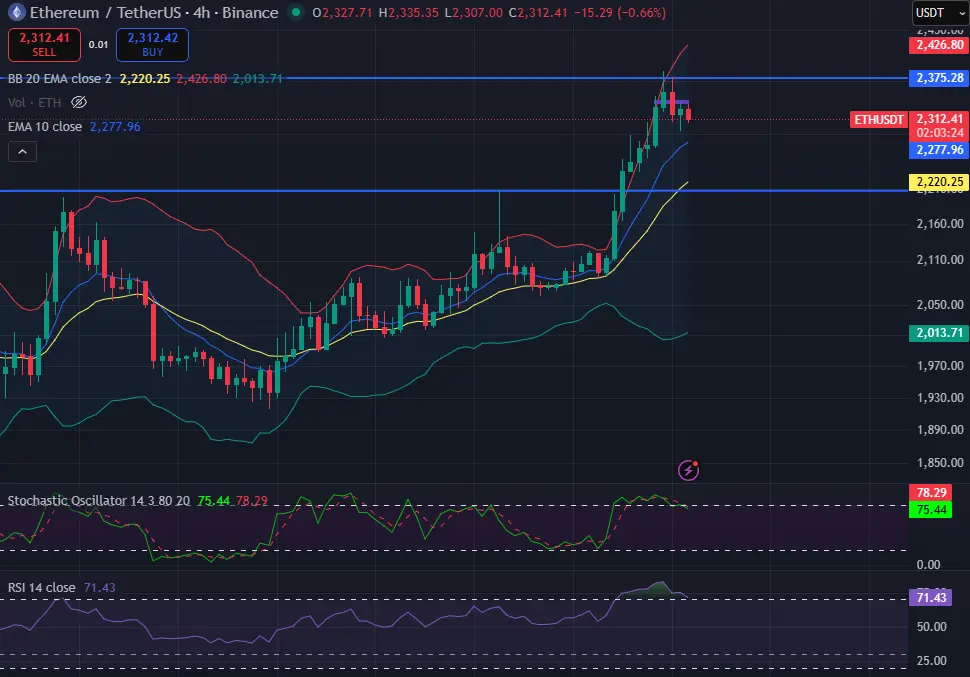
On the higher timeframe (H4), ETH/USD shows a strong bullish structure in recent sessions. However, price has now approached a key resistance zone and is showing clear signs of rejection.
The upper Bollinger Band has been tested, and momentum is starting to weaken. This indicates that buyers may be losing control, opening the door for a potential short-term pullback.
This ETHUSD intraday analysis highlights a high-probability short setup based on resistance rejection and indicator confluence.
Key Support & Resistance Levels
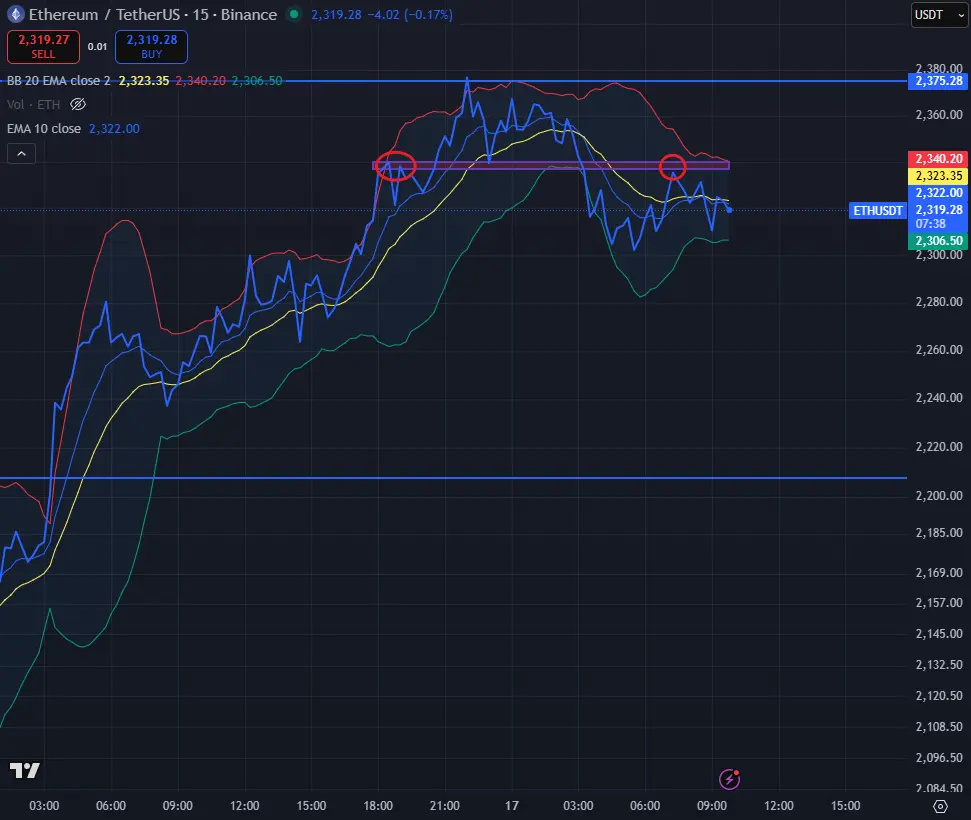
On the 15-minute timeframe, a critical support-turned-resistance (S/R flip) zone is clearly visible.
- Previous support has now become resistance
- Price failed to break above this zone multiple times
- Consolidation below resistance suggests bearish pressure
This type of structure is commonly used by intraday traders to identify short opportunities.
Entry Strategy (Short Setup)
The short-term setup is based on multiple indicator confluences:
- Resistance rejection at key level
- Price trading below short-term EMA
- Bollinger Bands contraction after expansion
- Momentum indicators (RSI & Stochastic) showing weakness
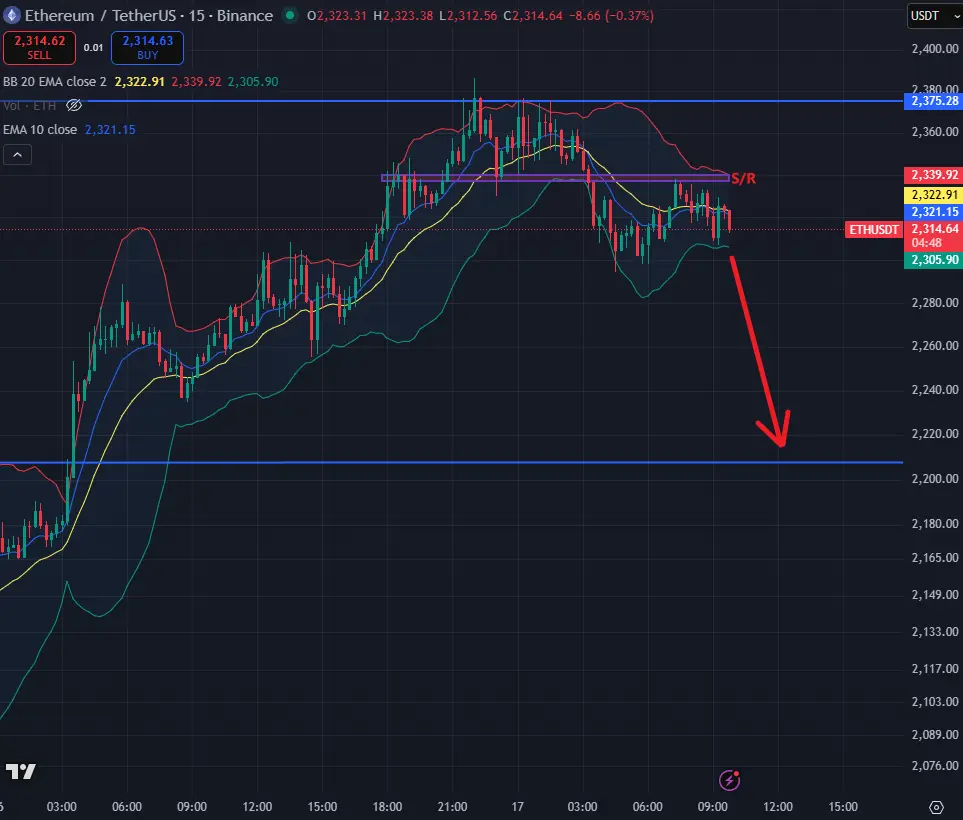
Suggested Entry Plan:
- Entry: Near resistance zone (around 2330 – 2340)
- Stop Loss: Above recent high / resistance
- Take Profit: Next support zone (~2200 area)
Trade Idea Summary
- Bias: Bearish (Short-term)
- Structure: Resistance rejection + lower highs
- Confirmation: Indicator confluence + failed breakout
If price continues to stay below the resistance zone, further downside movement is likely.
Risk Disclaimer
Trading involves significant risk and is not suitable for all investors. Always use proper risk management and never risk more than you can afford to lose.
About the Author
David William – Professional Forex & Crypto Trader
David William is a trader specializing in forex, gold (XAUUSD), and cryptocurrency markets. With over 8 years of trading experience, he focuses on technical analysis, price action, and market structure to identify high-probability trading opportunities.
More trading insights at trading-strategy-hub.com
Disclaimer: This analysis is for educational purposes only and does not constitute financial advice.