Introduction
Short-term trading requires precise entry and exit timing. Many traders combine multiple indicators to increase the probability of successful trades.
One effective approach is using a combination of RSI, Stochastic Oscillator, and Bollinger Bands to identify potential reversal points in the market.
This strategy is commonly used in intraday trading on lower timeframes such as M1, M5, and M15, helping traders capture quick market movements.
Indicators Used in This Strategy
This strategy combines three widely used technical indicators.
1. Bollinger Bands
Bollinger Bands help traders identify volatility and potential reversal areas.
When price touches or breaks the upper Bollinger Band, the market may be overextended and could reverse downward.
When price touches the lower Bollinger Band, the market may be oversold and could bounce upward.
2. RSI (Relative Strength Index)
RSI measures market momentum.
Typical levels used by traders:
- Above 70 → Overbought condition
- Below 30 → Oversold condition
When RSI reaches overbought levels, the probability of a short-term pullback increases.
3. Stochastic Oscillator
The Stochastic indicator also identifies overbought and oversold conditions.
Key signals include:
- Stochastic above 80 → Overbought
- Stochastic below 20 → Oversold
- Bearish crossover in the overbought zone often signals a potential reversal.
How RSI, Stochastic and Bollinger Bands Work Together
Each indicator in this strategy plays a different role in identifying potential trading opportunities.
Bollinger Bands help traders identify volatility and potential reversal zones when price reaches the upper or lower bands.
The RSI indicator measures momentum and helps determine whether the market is overbought or oversold.
The Stochastic oscillator provides additional confirmation by showing momentum shifts and potential reversals.
When these three indicators align, traders can identify stronger trading signals and improve the probability of successful short-term trades.
Entry Conditions for Short Trades
This strategy looks for short-term selling opportunities when the market becomes overbought.
A possible entry setup includes the following conditions:
- Price touches or moves outside the upper Bollinger Band.
- RSI approaches or exceeds 70, indicating overbought momentum.
- Stochastic moves above 80 and starts turning downward.
- Price begins to show weakness or rejection near resistance.
When these conditions appear together, traders may consider entering a short position.
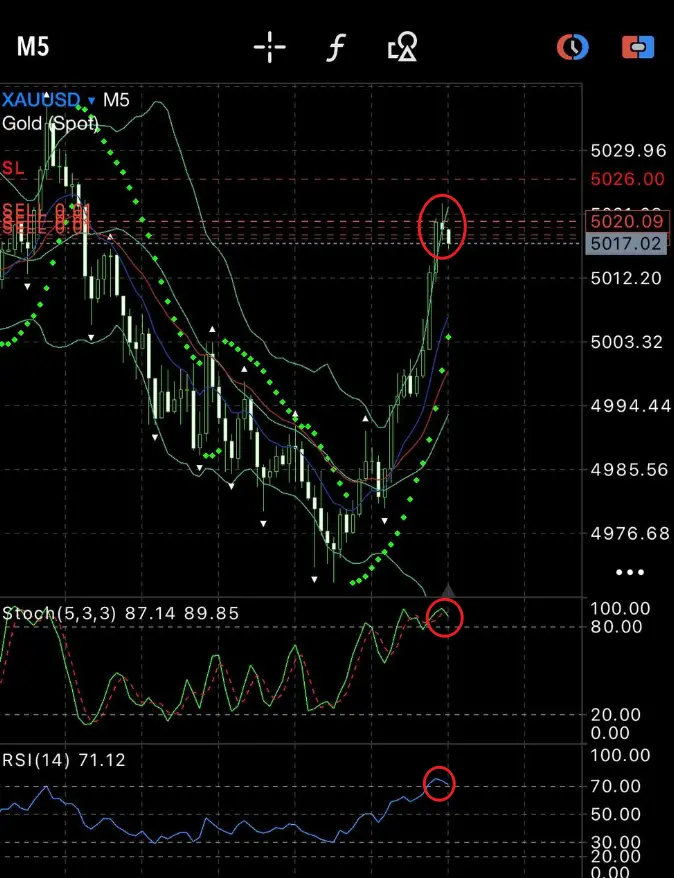
Example from the Gold (XAUUSD) Chart
In the chart example, we can observe the following sequence:
- Price rallied strongly and touched the upper Bollinger Band.
- The Stochastic indicator moved into the overbought zone.
- RSI also approached the overbought level, signaling stretched momentum.
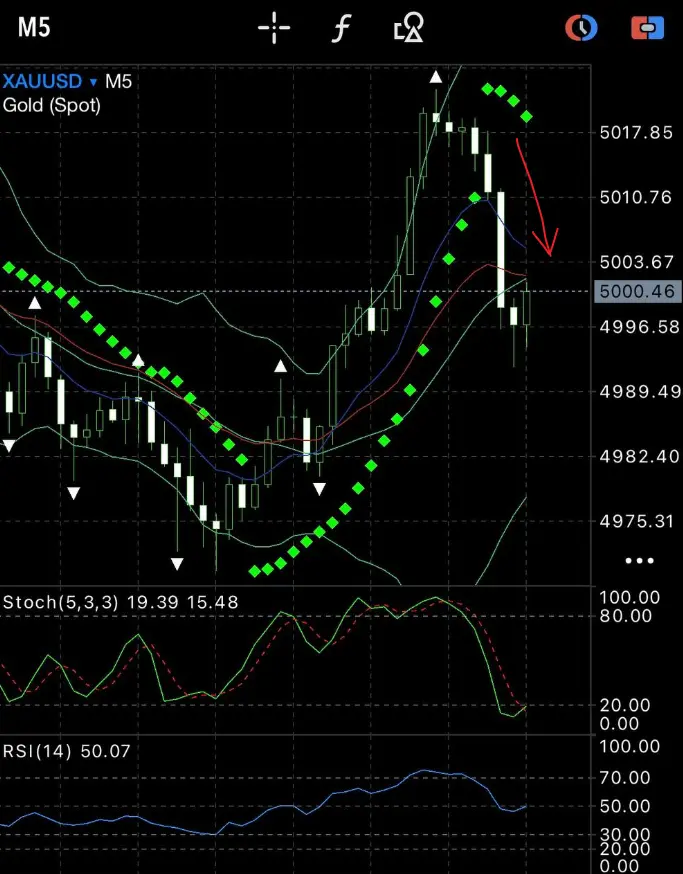
Shortly after these signals appeared together, the market began to reverse and move lower.
This type of setup is commonly seen in short-term trading environments.
Exit Strategy (Take Profit)
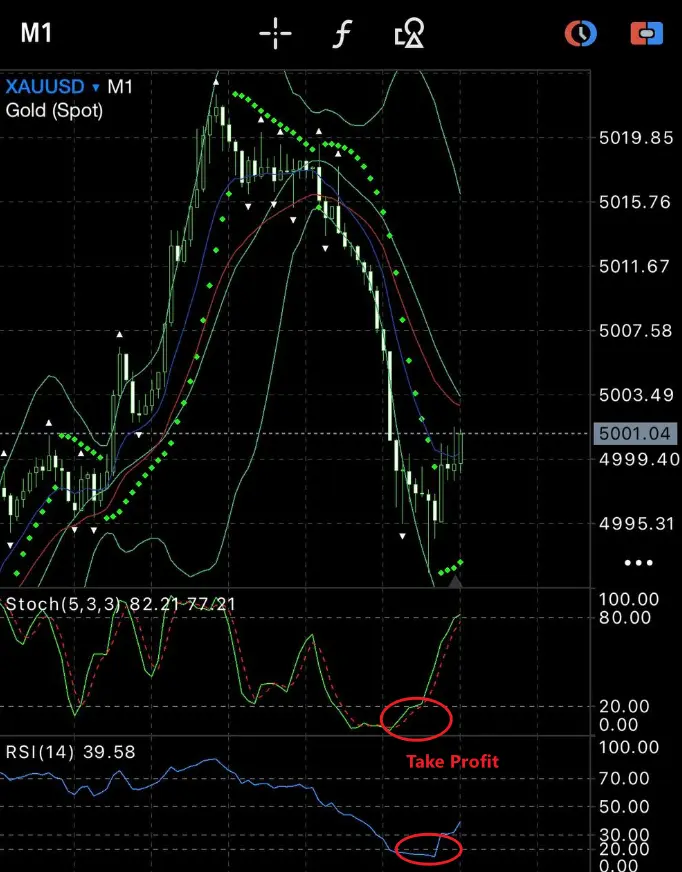
Managing exits is extremely important in short-term trading.
One useful technique is monitoring lower timeframes such as the 1-minute chart (M1).
If RSI on the M1 timeframe reaches overbought levels again during a retracement, it may signal that the downward move is losing momentum.
At this point, traders may consider taking profits to avoid giving back gains.
Short-term markets can reverse quickly, so locking in profits early can help protect trading performance.
Timeframes for This Strategy
This strategy can be applied on several intraday timeframes:
- M1 (1-minute chart) – for precise entries and exits
- M5 (5-minute chart) – for short-term trend confirmation
- M15 (15-minute chart) – for identifying broader intraday structure
Many traders use M5 or M15 for setup identification and then switch to M1 for timing the entry or exit.
Risk Management
Even when multiple indicators align, risk management remains essential.
Traders should consider:
- Setting stop losses above recent highs
- Avoiding overtrading
- Limiting risk per trade
- Taking profits when momentum begins to fade
Short-term trading involves rapid market changes, so discipline is critical.
Conclusion
The combination of RSI, Stochastic, and Bollinger Bands can provide a powerful framework for identifying short-term trading opportunities.
By watching for overbought conditions and price reactions near Bollinger Bands, traders may identify potential reversals and manage trades more effectively.
Using multiple timeframes such as M1, M5, and M15 can further improve entry and exit precision in intraday trading.
About the Author
David William – Professional Forex & Crypto Trader
David William is a trader specializing in forex, gold (XAUUSD), and cryptocurrency markets. With over 8 years of trading experience, he focuses on technical analysis, price action, and market structure to identify high-probability trading opportunities.
More trading insights at trading-strategy-hub.com
Disclaimer: This analysis is for educational purposes only and does not constitute financial advice.